Welcome to RNAvigate’s documentation!
Getting started
What is it and who is it for?
RNAvigate is a toolset for exploring RNA structure and chemical probing data. It is built for RNA bench scientists and with the following goals:
Be easy to learn and use with no coding experience
Reduce time-consuming tasks
Be transparent, reproducible, and shareable
Handle, and be extensible to, many input data formats and analyses
What problem does it solve?
Many tools and scripts exist to analyze RNA structure data via command line interfaces (CLIs) or graphical-user interfaces (GUIs). CLIs and GUIs each have trade-offs and are well suited to particular tasks. However, generally, neither is well suited for exploratory data analysis.
Interactive programming interfaces, such as Jupyter, provide a better workflow. Jupyter notebooks are a gold standard for reproducible data exploration, analysis, figure creation and reporting. However, they require programming fluency.
RNAvigate solves this by providing simple, intuitive commands that handle the minutiae of parsing and manipulating RNA-centric data and of implementing many of the common analyses and visualizations utilized by the RNA structure community.
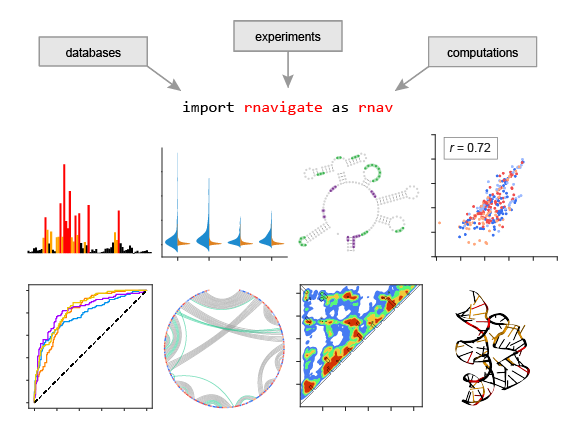
Workflow overview
RNAvigate separates the performance of three main tasks:
1. Curate inputs
First, input data files must be curated by searching databases or by performing experiments and pre-processing raw data. This is performed independently of RNAvigate.
2. Load and organize data
Second, using RNAvigate, the user creates one or more samples, the main organizational units in RNAvigate. Each sample contains the data related to a single experimental condition.
The datasets contained in a sample can be any combination of:
annotations (regions of interest)
secondary structures, optionally with drawing coordinates
tertiary structures with 3D atomic coordinates
per-nucleotide measurements
internucleotide measurements
3. Analyze and visualize data
Third, using RNAvigate’s built-in plotting and analysis functions, the user is free to visualize and explore their data. These functions automate many otherwise tedious and time consuming tasks. For example:
sequence alignments are used to correctly position datasets for comparison e.g., subsequences or deletion mutants
commonly used color representations are automated
data can be refiltered, renormalized, and/or masked on the fly
Questions, requests, and issues
Use GitHub issues (liberally!) to request new features, to report bugs or unexpected behavior, or simply to ask questions. I will respond quickly to these. The future development of RNAvigate will be guided by this kind of feedback.
In many cases, it is easy to expand RNAvigate to accept new data file formats. Use the link above to request support for a new format or a new visual language (like the red-orange-black-grey scale for structure probing reactivity), include an example file and/or example visualization. For more information on the broad categories of data that are well-suited for inclusion, see Data classes.
Developers
Contact me if you are interested in helping to improve RNAvigate or in using RNAvigate in your own projects.
These developer resources are works-in-progress.