Replicate averaging
Every Profile subclass (rnav.data.Profile, SHAPEMaP, DanceMaP, RNPMaP) optionally accepts a list of file names or rnav.Data objects as input_data.
the active metric column is averaged across replicates
the standard error of the mean is stored as
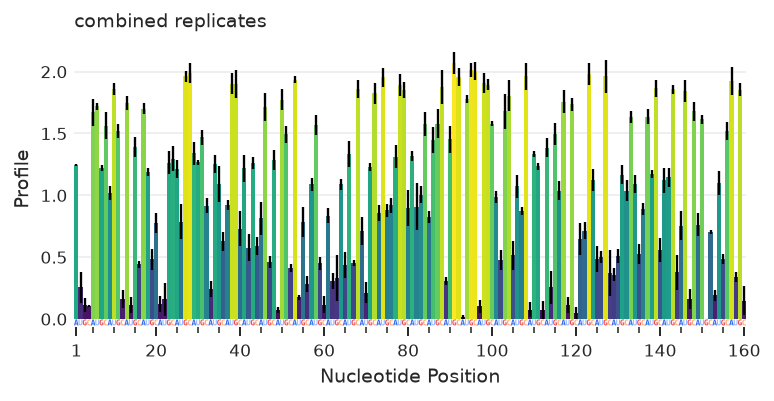
<metric_column>_semand registered as theerror_column, so error bars appear automatically on profile and skyline plots
This applies to the shapemap, dancemap, rnpmap, profile and other related standard data keywords.
[1]:
import numpy as np
import rnavigate as rnav
Averaging replicate profiles
Below, 3 synthetic replicate measurements are built around a shared “true” signal using rnav.data.Profile.from_array. Each behaves exactly like a Profile loaded from a file. Passing a list of them to rnav.data.Profile averages them the same way a list of shapemap profile.txt paths would.
[2]:
rng = np.random.default_rng(0)
sequence = "AUGC" * 40  # 160 nt shared sequence
true_signal = rng.random(160) * 2

replicates = [
    rnav.data.Profile.from_array(
        input_data=np.clip(true_signal + rng.normal(scale=0.15, size=160), 0, None),
        sequence=sequence,
        metric="Profile",
    )
    for _ in range(3)
]

combined = rnav.data.Profile(input_data=replicates, metric="Profile")
combined.data[["Nucleotide", "Profile", "Profile_sem"]].head()
[2]:
| Nucleotide | Profile | Profile_sem | |
|---|---|---|---|
| 0 | 1 | 1.241486 | 0.008419 |
| 1 | 2 | 0.254430 | 0.127734 |
| 2 | 3 | 0.111551 | 0.056524 |
| 3 | 4 | 0.103458 | 0.009227 |
| 4 | 5 | 1.672009 | 0.110121 |
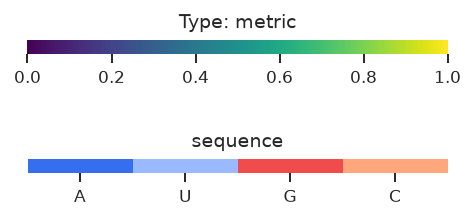
combined.error_column is now "Profile_sem", so error bars are drawn automatically:
[3]:
my_sample = rnav.Sample(sample="combined replicates", my_profile=combined)

plot = rnav.plot_profile(
    samples=[my_sample],
    profile="my_profile",
)
Loading replicates from files
In practice, replicates usually come from files. Any profile-creating data keyword accepts a list of paths in place of a single file. RNAvigate loads each one, checks that they share a sequence, and averages them:
my_sample = rnav.Sample(
    sample="example",
    shapemap=[
        "replicate_1_profile.txt",
        "replicate_2_profile.txt",
        "replicate_3_profile.txt",
    ],
)
This is equivalent to constructing each SHAPEMaP replicate individually and combining them with SHAPEMaP.from_replicates([...]). The same list syntax works for dancemap and rnpmap.
Normalizing before averaging
Replicates are sometimes on different scales, e.g. differing sequencing depth or overall reactivity. Pass normalize_kwargs to renormalize each replicate with Profile.normalize(**normalize_kwargs) before averaging, rather than only normalizing the final combined profile.
[4]:
scaled_replicates = [
    rnav.data.Profile.from_array(
        input_data=np.clip((true_signal + rng.normal(scale=0.15, size=160)) * scale, 0, None),
        sequence=sequence,
        metric="Profile",
    )
    for scale in [0.5, 1.0, 1.5]  # 3 replicates on very different scales
]

raw_mean = rnav.data.Profile(
    input_data=scaled_replicates, metric="Profile"
).data["Profile"].mean()

rescaled_mean = rnav.data.Profile(
    input_data=scaled_replicates,
    metric="Profile",
    normalize_kwargs={"norm_method": "boxplot", "new_profile": "Profile"},
).data["Profile"].mean()

print(f"averaged without renormalizing: {raw_mean:.3f}")
print(f"averaged after per-replicate renormalizing: {rescaled_mean:.3f}")
Warning: seq-object missing expected error column
Warning: seq-object missing expected error column
Warning: seq-object missing expected error column
averaged without renormalizing: 1.055
averaged after per-replicate renormalizing: 0.532
Note: If the metric has a color_column distinct from its metric column, RNAvigate warns that coloring falls back to the first replicate. Averaging does not currently combine colors.
See also: Custom profiles for other ways to construct Profile objects, and standard data keywords for the shapemap, dancemap, rnpmap, and profile keywords.