Custom interactions
RNAvigate can create Interactions data from several common filetypes through the use of standard data keywords. However, you may wish to visualize Interactions that come from other sources of data.
Below, I show an example of Interactions data created from a manually created DataFrame and sequence. This also applies to data that was created in Python or that is stored in an otherwise unsupported file type. As long as it can be coerce into a DataFrame with the following structure, it can be visualized with RNAvigate.
One row per interaction
Two columns with the positions of the interacting nucleotides (1-indexed)
for interacting windows, the position of the 5’ most nucleotide of each window
Additional columns to hold quantitative information about each interaction
If you ever have trouble getting data to work with RNAvigate, feel free to submit an issue. I usually respond with a day or two. Please include example data.
For common standardized file formats, I can add automatic parsing to RNAvigate. This is usually very easy and worth my time. To request this, submit a GitHub issue, included an example file, a detailed file format specification, and an example visualization (for the default color palette).
Manually created Interactions data
[1]:
import rnavigate as rnav
import pandas as pd
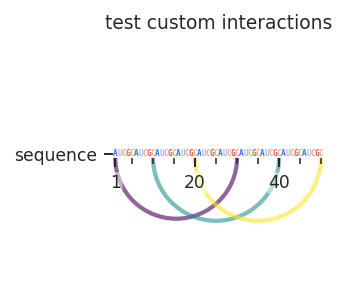
sample = rnav.Sample(
sample="test custom interactions",
interactions=rnav.data.Interactions(
input_data=pd.DataFrame(
{
"i": [1, 10, 20],
"j": [30, 40, 50],
"score": [0.1, 0.2, 0.3],
}
),
sequence="AUCGCAUCGCAUCGCAUCGCAUCGCAUCGCAUCGCAUCGCAUCGCAUCGC",
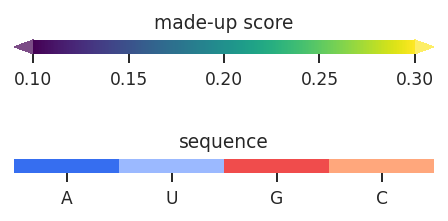
metric="score",
metric_defaults={
"score": {
"metric_column": "score",
"cmap": "viridis",
"normalization": "min_max",
"values": [0.1, 0.3],
"extend": "both",
"title": "made-up score",
"alpha": 0.7,
}
},
),
)
rnav.plot_arcs(
samples=[sample],
sequence="interactions",
interactions="interactions",
)
[1]:
<rnavigate.plots.arc.AP at 0x7c5aa1528290>
[ ]: