Distance distribution histograms
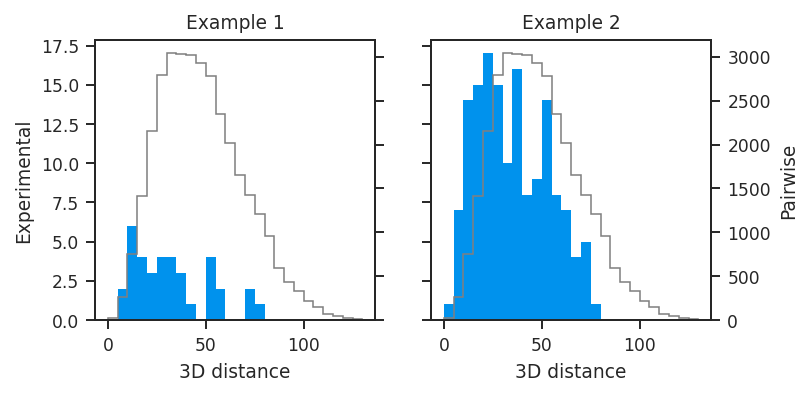
Distance distribution histograms provide a method of determining how well inter-nucleotide data and filtering schemes isolate close-in-space contacts. A histogram of the atomic 3D distances of filtered internucleotide data is compared to a “background” 3D distance histogram. The background histogram by default is the distribution of all pairwise 3D distances in the given 3D structure. It can also be defined by first creating an inter-nucleotide data set consisting of all nucleotide pairs using
the allpossible argument with rnav.Sample(), and filtering these.
[1]:
import rnavigate as rnav
from rnavigate.examples import rnasep_1, rnasep_2

plot = rnav.plot_disthist(
    samples=[rnasep_1, rnasep_2],
    interactions="ringmap",
    structure="pdb",
)
[2]:
help(rnav.plot_disthist)
Help on function plot_disthist in module rnavigate.plotting_functions:

plot_disthist(samples, structure, interactions, bg_interactions=None, labels=None, same_axis=False, atom="O2'", rows=None, cols=None, plot_kwargs=None)
    Calculates 3D distance of nucleotides in inter-nucleotide data and plots
    the distribution of these distances. Compares this to a "background"
    distribution consisting of either all pairwise distances in structure, or
    those defined by bg_interactions and bg_interactions_filter

    Parameters
    ----------
    samples : list of rnavigate Samples
        Samples from which to retreive data
        There will be one panel for each sample unless same_axis is True
    structure : data keyword string or data object
        secondary structure or 3D structure to calculate inter-nucleotide
        contact distance or 3D distance, respectively
    interactions : one of the formats below, defaults to None
        format 1 (data or data keyword)
            Interactions used to calculate distance histogram, no filtering
        format 2 (dictionary)
            e.g. {"interactions": format 1}
            additional filtering options can be added to the dictionary
        format 3 (list of format 2 dictionaries)
            This format allows multiple filtering schemes to be applied,
            each will be plotted on a seperate axis
    bg_interactions : one of the formats below, defaults to None
        format 1 (data or data keyword)
            Interactions to calculate background distance histogram, no
            filtering is performed
        format 2 (dictionary)
            e.g. {"interactions": format 1}
            additional filtering options can be added to the dictionary
        if not provided, background distance histogram is calculated from
        all pairwise distances in structure
    labels : list of strings, defaults to sample.sample for each sample
        Labels to be used as titles, must be same length as samples list
        Defaults to sample.sample for each sample
    atom : string or dictionary, defaults to "O2'"
        from which atoms to calculate distances
        for DMS reactive atoms (N1 for A and G, N3 for U and C) use "DMS"
        use a dictionary to specify a different atom for each nucleotide
        e.g. "DMS" == {"A": "N1", "G": "N1", "U": "N3", "C": "N3"}
    rows : integer, defaults to None (determined automatically)
        number of rows of plots
    cols : integer, defaults to None (determined automatically)
        number of columns of plots
    plot_kwargs : dictionary, defaults to {}
        Keyword-arguments passed to matplotlib.pyplot.subplots

    Returns
    -------
    rnavigate.plots.DistHist
        object containing matplotlib figure and axes with additional plotting and
        file saving methods