ShapeMapper2 profiles
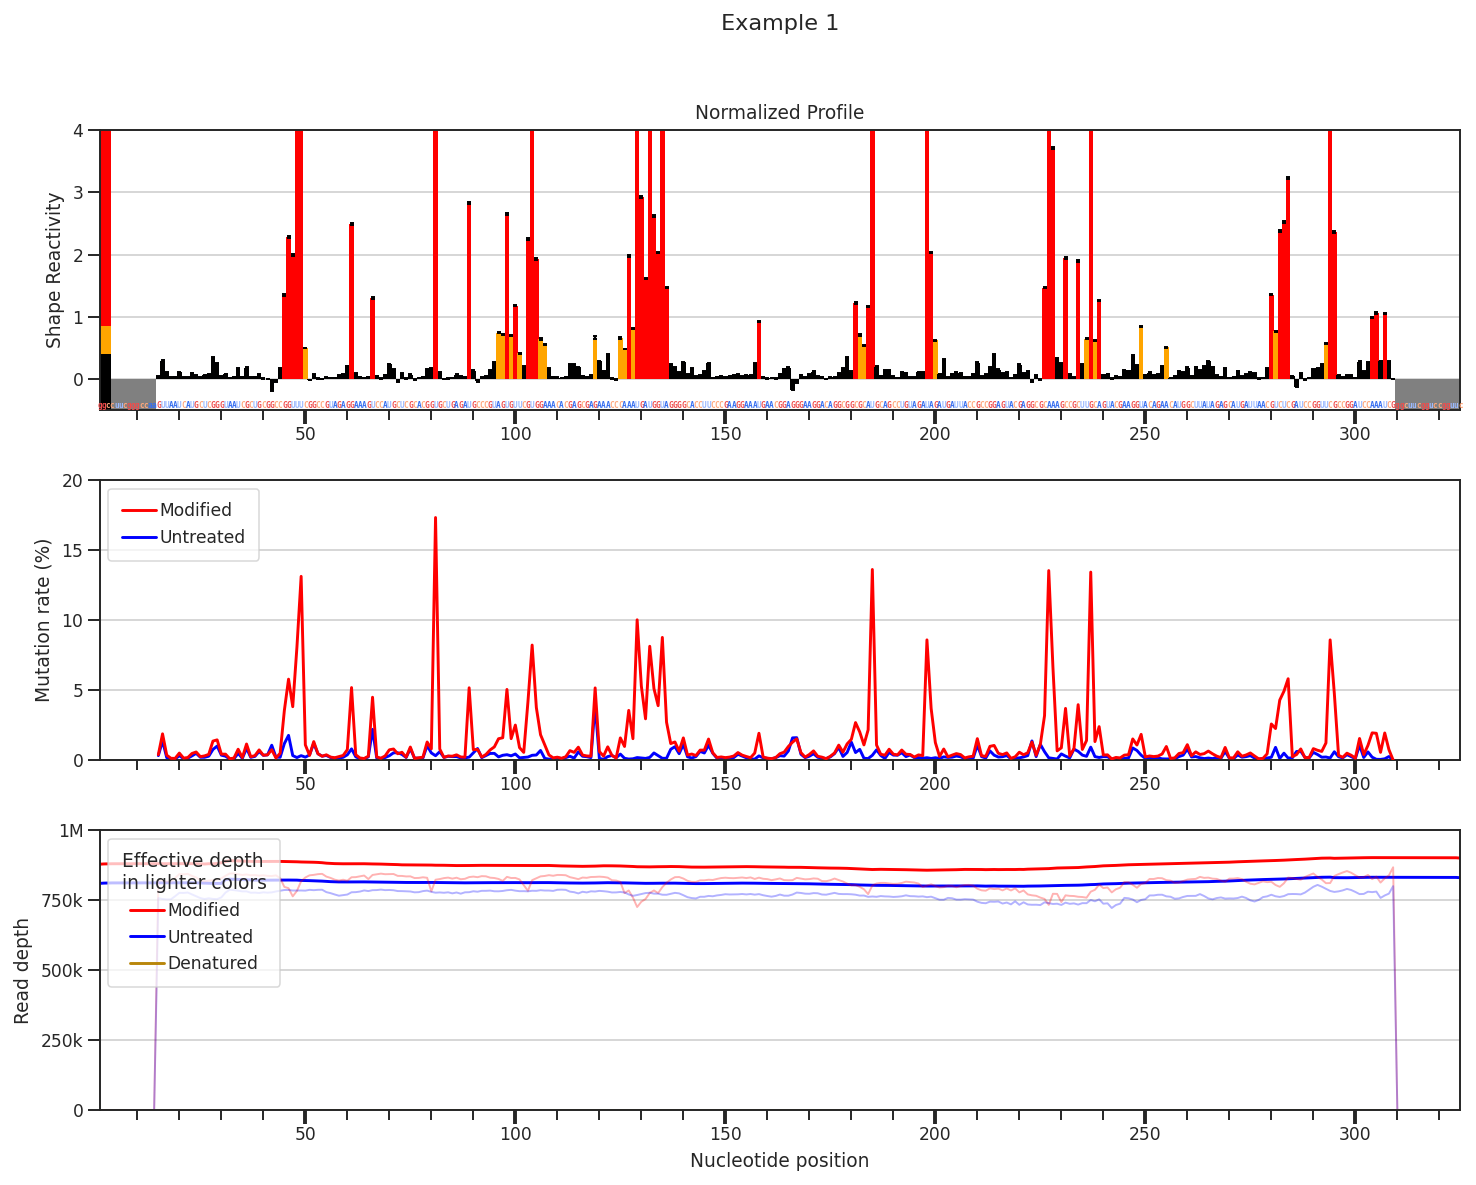
ShapeMapper2 produces a useful, recognizable plot with 3 panels: Normalized SHAPE reactivities, Mutation rates with measurement errors for modified, untreated, and optional denatured samples, and read depths and effective read depths for all samples.
[1]:
import rnavigate as rnav
from rnavigate.examples import rnasep_1

plot = rnav.plot_shapemapper(
    sample=rnasep_1,
    profile="shapemap",
)
[2]:
help(rnav.plot_shapemapper)
Help on function plot_shapemapper in module rnavigate.plotting_functions:

plot_shapemapper(sample, profile, label=None, panels=None)
    Makes a standard ShapeMapper2 profile plot with 3 panels: Normalized
    Reactivities, mutation rates, and read depths.

    Parameters
    ----------
    sample : rnavigate Sample
        The sample from which data profile and label will be retreived
    profile : data keyword string or data object
        ShapeMaP or similar data for plotting profiles
    label : str, defaults to sample.sample
        A label to use as the title of the figure
    panels : list of str, defaults to ["profile", "rates", "depth"]
        Which panels to include: options are "profile", "rates", and "depth"

    Returns
    -------
    rnavigate.plots.SM
        the ShapeMapper2 plot object