Arc plots
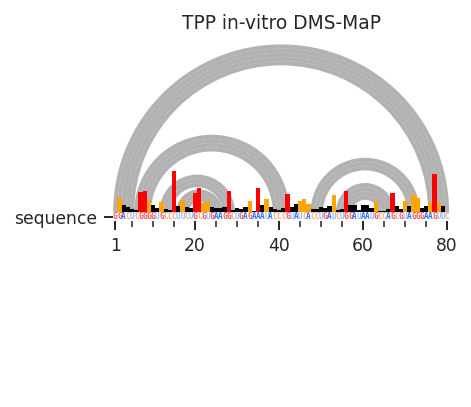
Arc plots are a flexible plot type for comparing multiple layers of RNA data simultaneously. Sequence annotations, per-nucleotide data, inter-nucleotide data, and secondary structures can all be displayed on arc plots.
[1]:
import rnavigate as rnav
from rnavigate.examples import tpp

plot = rnav.plot_arcs(
    samples=[tpp],
    sequence="ss",
    structure="ss",
    profile="dmsmap",
    profile_scale_factor=5,
)
[2]:
help(rnav.plot_arcs)
Help on function plot_arcs in module rnavigate.plotting_functions:

plot_arcs(samples, sequence, structure=None, structure2=None, interactions=None, interactions2=None, profile=None, annotations=None, domains=None, labels=None, nt_ticks=(20, 5), profile_scale_factor=1, plot_error=False, annotation_mode='track', panels=None, seqbar=True, region='all', colorbars=True, title=True, plot_kwargs=None)
    Plots interactions and/or base-pairs as arcs.

    Parameters
    ----------
    samples : list of rnavigate Samples
        samples used to retrieve data
    sequence : data keyword string, data object, or sequence string
        All data are mapped to this sequence before plotting
        If a data keyword string, data from the first sample will be used
    structure : data keyword string or data object, defaults to None
        secondary structure to plot as arcs
    structure2 : data keyword string or data object, defaults to None
        another secondary structure to compare with the first structure
        arcs will be colored depending on which structure they are in
        Defaults to None
    interactions : one of the formats below, defaults to None
        format 1 (data or data keyword)
            Interactions to plot as arcs, no filtering performed
        format 2 (dictionary)
            e.g. {"interactions": format 1}
            additional filtering options can be added to the dictionary
        format 3 (list of format 2 dictionaries)
            This format allows multiple filtering schemes to be applied,
            each will be plotted on a seperate axis
    interactions2 : one of the formats below, defaults to None
        format 1 (data or data keyword)
            Interactions to plot as arcs, no filtering performed
        format 2 (dictionary)
            e.g. {"interactions": format 1}
            additional filtering options can be added to the dictionary
    profile : data or data keyword, defaults to None
        Profile from which values will be plotted
    annotations : list of data keyword strings or data objects, defaults to []
        Annotations used to highlight regions or sites of interest
    domains : data keyword string or data object, defaults to None
        domains to label along x-axis
    labels : list of strings, defaults to sample.sample for each sample
        list containing Labels to be used in plot legends
    nt_ticks : tuple of two integers, defaults to (20, 5)
        first integer is the gap between major tick marks
        second integer is the gap between minor tick marks
    profile_scale_factor : number, defaults to 1
        small profile values will be hard to see
        large profile values will overwhelm the plot
        e.g. use 1/10 to scale values down 10-fold, use 10 to scale up
    plot_error : bool, defaults to False
        Whether to plot error bars, values are determined by profile.metric
    annotation_mode : { "track" | "bars"}, default "track"
        "track" will highlight annotations along the x-axis
        "bars" will use a vertical transparent bar over the plot
    panels : dict, optional
        a dictionary of whether plot elements are displayed on the "top"
        (above x-axis) or "bottom" (below x-axis)
        Only the values you wish to change from the default are needed
        defaults to {"interactions": "bottom", "interactions2": "bottom",
        "structure": "top", "profile": "top"}
    seqbar : bool, default ``True``
        whether to display the sequence along the x-axis
    region : list of 2 integers, defaults to [1, length of sequence]
        start and end positions to plot. 1-indexed, inclusive.
    colorbars : bool, default ``True``
        Whether to plot colorbars for all plot elements
    title : bool, defaults to True
        Whether to display titles for each axis
    plot_kwargs : dict, defaults to {}
        Keyword-arguments passed to matplotlib.pyplot.subplots

    Returns
    -------
    rnavigate.plots.AP
        the ArcPlot object