Custom profiles
RNAvigate can create Profile data from several common filetypes through the use of standard data keywords. However, you may wish to create Profiles from other file types or from values that you have calculated in Python.
There are options to turn almost anything into a full-featured RNAvigate profile.
If you are having trouble getting a particular data file to work with RNAvigate, feel free to submit an issue. Please include an example file or detailed file specification.
For common standardized file formats, it may be worthwhile (and easy!) to add automatic parsing to RNAvigate. For this, submit a GitHub issue, included an example file, a detailed file spec, and an example visualization.
[1]:
import rnavigate as rnav
import numpy as np
import pandas as pd
An array of values
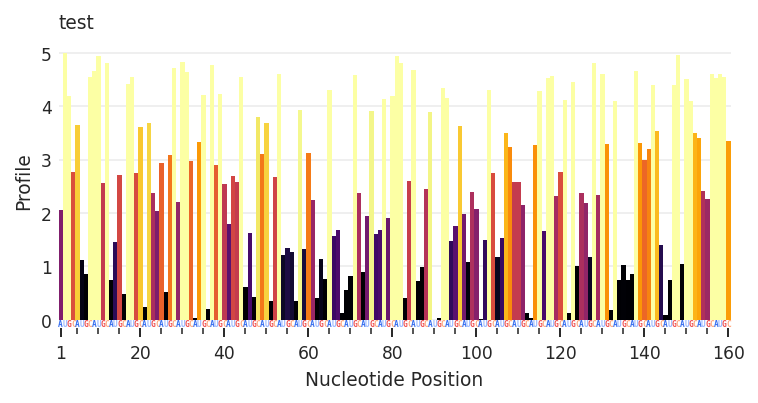
We start with an array of values and a sequence. This array must be 1 value for each nucleotide. The input sequence can be an existing RNAvigate data object, a fasta file, or a sequence string. Here I am using a sequence string.
Using an arbitrary data keyword, we can directly create and assign any RNAvigate data object. Here I use rnav.data.Profile.from_array to create the profile.
input_data (the array) and sequence (a data object, fasta file, or sequence string) arguments are required. metric and metric_defaults allow me to customize the color representation of the data and the associated colorbar legend. "Profile" is the default name given to the column containing the input array.
[2]:
my_array = np.random.rand(160) * 5 # 160 random values between 0 and 5
my_sequence = "AUGC" * 40 # AUGC repeating 40 times (160 nts total)
test = rnav.Sample(
sample="test",
my_profile=rnav.data.Profile.from_array(
input_data=my_array,
sequence=my_sequence,
metric="Profile",
metric_defaults={
"Profile": {
"metric_column": "Profile",
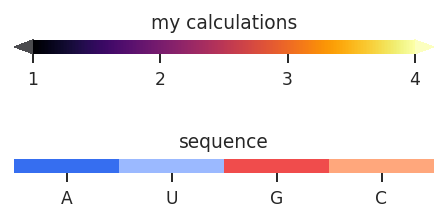
"title": "my calculations",
"cmap": "inferno",
"normalization": "min_max",
"values": [1, 4],
"ticks": [1, 2, 3, 4],
"extend": "both"
}
}
)
)
plot = rnav.plot_profile(
samples=[test],
profile="my_profile",
)
Warning: seq-object missing expected error column
A Pandas DataFrame
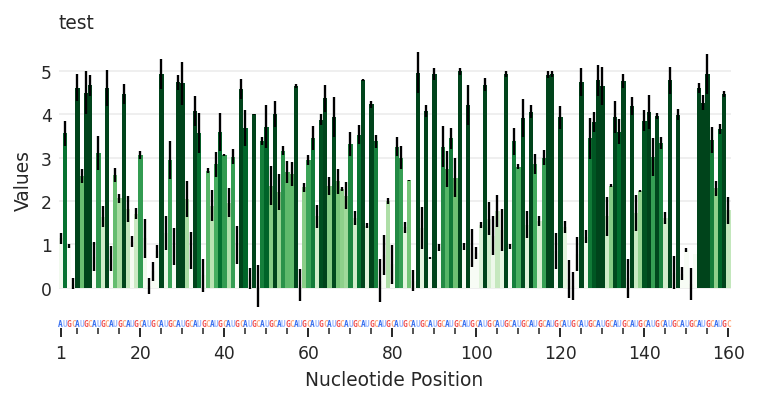
DataFrames provide more flexibility than arrays of values. These can contain any number of columns, containing per-nucleotide values and optional error rates.
This DataFrame must start with a particular structure:
one row per nucleotide
A “Nucleotide” column containing nucleotide positions
A “Sequence column containing the nucleotide identities
Any number of additional columns
Again, using an arbitrary data keyword, we can directly create and assign any RNAvigate data object. Here I use rnav.data.Profile to create the profile.
input_data (the DataFrame) argument is required. metric and metric_defaults allow me to customize the color representation of the data and the associated colorbar legend. Color representation can be defined seperately for different columns.
[3]:
my_data = pd.DataFrame({
"Nucleotide": np.arange(1, 161), # positions 1 through 160
"Sequence": [nt for nt in "AUGC"*40], # AUGC repeating 40 times (160 nts total)
"Values": np.random.rand(160) * 5, # 160 random values between 0 and 5
"Errors": np.random.rand(160) / 2, # 160 random values between 0 and 0.5
"Values_2": np.random.rand(160) * 11 // 1, # 160 random integer values between 0 and 10
})
test = rnav.Sample(
sample="test",
my_profile=rnav.data.Profile(
input_data=my_data,
metric="Values",
metric_defaults={
"Values": {
"metric_column": "Values",
"error_column": "Errors",
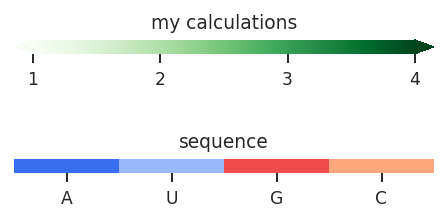
"title": "my calculations",
"cmap": "Greens",
"normalization": "min_max",
"values": [1, 4],
"ticks": [1, 2, 3, 4],
"extend": "both",
"alpha": 1,
},
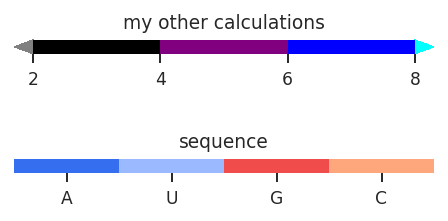
"Values_2": {
"metric_column": "Values_2",
"error_column": None,
"title": "my other calculations",
"cmap": ["grey", "black", "purple", "blue", "cyan"],
"normalization": "bins",
"values": [2, 4, 6, 8],
"extend": "both",
"alpha": 1,
}
}
)
)
plot = rnav.plot_profile(
samples=[test],
profile="my_profile",
)
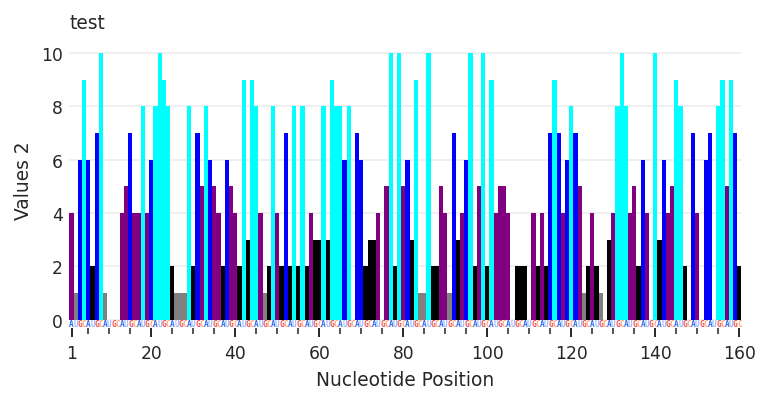
Having defined how to represent “Value” and “Value_2”, I can easily toggle between them by setting the metric value.
[4]:
test.get_data("my_profile").metric = "Values_2"

plot2 = rnav.plot_profile(
    samples=[test],
    profile="my_profile",
)
Warning: seq-object missing expected error column
A table-like data file
Similar to the DataFrames described above, if a table-like data file follows this structure, it can be used to create a Profile directly.
one row per nucleotide
A column containing nucleotide positions
A column containing the nucleotide identities
Any number of additional columns
I haven’t yet made an example file to demonstrate this section, so you just have to trust me that this works.
If we have a file with the following structure:
a multiline header to ignore
a 4-column comma-separated row of column names: pos, nt, x, and y
a 4-column comma-separated table of values (1 row per nucleotide)
# A multiline header
# containing meta-data
pos,nt,x,y
1,A,0.5,9
...and so on
This file can be coerced into the expected DataFrame format:
my_data = pd.read_table(
    "path/to/my_file.csv",
    sep=",",
    comment="#",
    header=0,
    names=["Nucleotide", "Sequence", "X_position", "Y_position"]
)
The Pandas function pd.read_table is a powerful method to coerce table-like files into DataFrames and has many options. my_data is now a DataFrame that can be used to create a profile in the method described earlier.
RNAvigate also has a shortcut to turn this file directly into a Profile. This is accomplished by passing the necessary read_table arguments through the Profile constructor.
test = rnav.Sample(
    sample="test",
    my_profile=rnav.data.Profile(
        input_data="path/to/my_file.csv",
        read_table_kw={
            "sep": ",",
            "comment": "#",
            "header": 0,
            "names": ["Nucleotide", "Sequence", "X_position", "Y_position"]
        }
    )
)
A non-table-like data file
This requires the use of Pandas to coerce the file into a suitable DataFrame. There are too many possibilities here for me to cover, so I will just suggest a few Google searches to get you started:
Google: “pandas IO tools” Pandas has built-in tools to read CSV, Fixed-width, JSON, HTML, XML, Excel, and many others.
Google: “how do I turn _ into a pandas dataframe” There is probably a good stack overflow answer out there.