Heatmap and contour plots
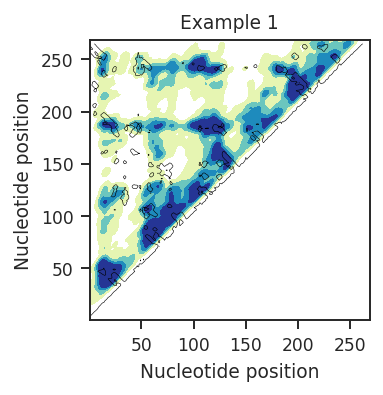
Heatmaps and contour plots are a good way to view inter-nucleotide data when the data are very dense, or when you wish to view inter-nucleotide data density. The x and y axes are nucleotide positions. XY-positions are colored by inter-nucleotide data values or density (heatmap) and overlayed with a contour map. This contour map can show either 3D distance or secondary structure graph path distance (contact distance). These countours will outline areas where nucleotide X is close, in 3D space or secondary structure, to nucleotide Y.
[1]:
import rnavigate as rnav
from rnavigate.examples import rnasep_1

plot = rnav.plot_heatmap(
    samples=[rnasep_1],
    sequence="pdb",
    structure="pdb",
    interactions="shapejump",
    plot_type="kde",
)
[2]:
help(rnav.plot_heatmap)
Help on function plot_heatmap in module rnavigate.plotting_functions:

plot_heatmap(samples, sequence, structure=None, interactions=None, regions=None, labels=None, levels=None, interpolation='nearest', atom="O2'", plot_type='heatmap', weights=None, rows=None, cols=None, plot_kwargs=None)
    Generates a multipanel plot displaying a heatmap of inter-nucleotide
    data (nucleotide resolution of 2D KDE) and/or contour map of pdb
    distances. Each plot may display a unique sample and/or filtering scheme.

    Parameters
    ----------
    samples : list of rnavigate Samples
        samples used to retrieve data
    sequence : data keyword string, data object, or sequence string
        All data are mapped to this sequence before plotting
    structure : data keyword string or data object, defaults to None
        secondary structure or 3D structure used to plot contour lines
        contour lines are drawn according to levels argument
    interactions : one of the formats below, defaults to None
        format 1 (data or data keyword)
            Interactions to plot as a heatmap, no filtering performed
        format 2 (dictionary)
            e.g. {"interactions": format 1}
            additional filtering options can be added to the dictionary
        format 3 (list of format 2 dictionaries)
            This format allows multiple filtering schemes to be applied,
            each will be plotted on a seperate axis
    regions : list of lists of 4 integers, defaults to None (no boxes)
        each inner list defines two regions of the RNA that are interacting
        a box will be drawn around this interaction on the heatmap
        e.g. [[10, 20, 50, 60], [35, 45, 70, 80]] draws 2 boxes
        the first connects nucleotides 10-20 and 50-60,
        the second connects nucleotides 35-45 and 70-80
    labels : list of strings, defaults to sample.sample for each sample
        Labels to be used as titles, must be same length as samples list
    levels : list of floats, defaults to [5] contact distance or [20] 3D distance
        contours are drawn separating nucleotides above and below these distances.
        If structure is a secondary structure, distance refers to contact distance.
        If structure is a 3D structure, distance refers to spatial distance in angstroms.
    interpolation : string, defaults to "nearest"
        one of matplotlib's interpolations for heatmap (used with imshow)
        "nearest" works well for shorter RNAs (under 300 nt)
        "none" works well for longer RNAs (over 1200 nt)
    atom : string or dictionary, defaults to "O2'"
        from which atoms to calculate distances
        for DMS reactive atoms (N1 for A and G, N3 for U and C) use "DMS"
        use a dictionary to specify a different atom for each nucleotide
        e.g. "DMS" == {"A": "N1", "G": "N1", "U": "N3", "C": "N3"}
    plot_type : "heatmap" or "kde", defaults to "heatmap"
        how to plot interactions data
        "heatmap" will plot raw data, each interaction is a pixel in a grid
        "kde" will calculate a kernel density estimate and plot 5 levels
    weights : string, defaults to None (no weights)
        weights to be used in kernel density estimation
        must be a column of interactions data
    rows : integer, defaults to None (determined automatically)
        number of rows of plots
    cols : integer, defaults to None (determined automatically)
        number of columns of plots
    plot_kwargs : dictionary, defaults to {}
        Keyword-arguments passed to matplotlib.pyplot.subplots

    Returns
    -------
    rnavigate.plots.Heatmap
        object containing matplotlib figure and axes with additional plotting and
        file saving methods