Linear regression plots
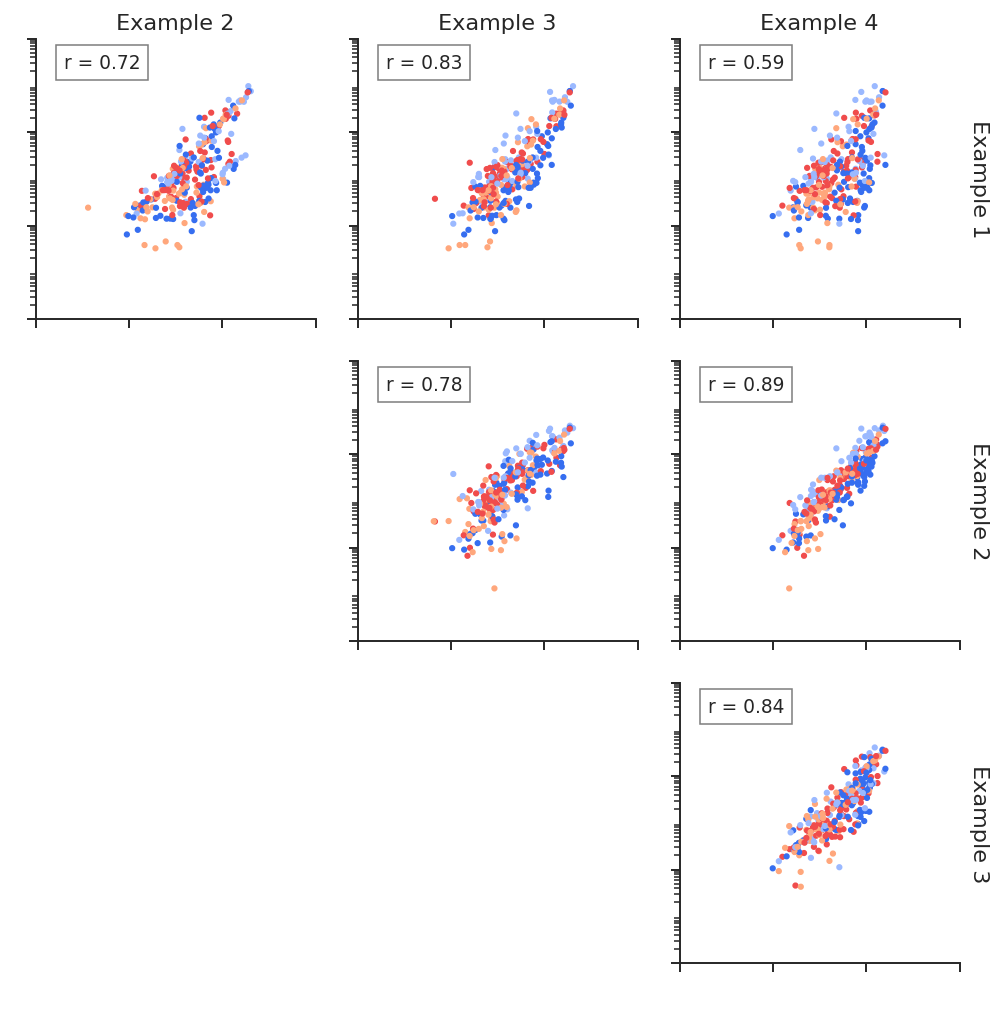
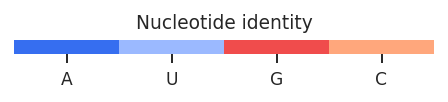
Linear regression plots are useful to determine reproducibility between replicates, or to quickly quantify the difference between structural states. RNAvigate creates scatter plots of per-nucleotide values from one sample on the x-axis for another sample on the y-axis. Slope and R^2 values are displayed. Nucleotides can be colored by sequence or base-pairing status. A KDE of paired/unpaired reactivity distributions may also be plotted for each sample.
[1]:
import rnavigate as rnav
from rnavigate.examples import rnasep_1, rnasep_2, rnasep_3, rnasep_4

plot = rnav.plot_linreg(
    samples=[rnasep_1, rnasep_2, rnasep_3, rnasep_4],
    profile="shapemap",
    scale="log",
)
[2]:
help(rnav.plot_linreg)
Help on function plot_linreg in module rnavigate.plotting_functions:

plot_linreg(samples, profile, sequence=None, structure=None, annotations=None, labels=None, kde=False, scale='linear', regression='pearson', colors='sequence', column=None, region='all', colorbars=True, plot_kwargs=None)
    Performs linear regression analysis and generates scatter plots of all
    sample-to-sample profile vs. profile comparisons. Colors nucleotides by
    identity or base-pairing status.

    Parameters
    ----------
    samples : list of rnavigate Samples
        samples used to retrieve data
    profile : data keyword string or data object
        per-nucleotide data to perform linear regression
        all data are mapped to the sequence of the profile data from the
        first sample before plotting, unless sequence is supplied
    sequence : data keyword str, data obj, or sequence str, defaults to None
        a sequence from which to align all profiles
        if a data keyword, uses data from the first sample
    structure : data keyword string or data object, defaults to None
        Structure used for coloring if colors argument is "structure"
    annotations : list of data keyword strings or data objects, defaults to []
        Annotations used for coloring if colors argument is "annotations"
    labels : list of strings, defaults to sample.sample for each sample
        list containing Labels to be used in plot legends
    kde : bool, defaults to False
        whether to plot kde (density) instead of a scatter plot
    scale : "linear" or "log", defaults to "linear"
        "linear" performs regression on raw values, displays linear units
        "log" performs regression on log10(values), displays log10 units
    regression : "pearson" or "spearman", defaults to "pearson"
        "pearson" calculates Pearson R-squared (standard)
        "spearman" calculates Spearman R-squared (rank-order)
    colors : string or list of colors, defaults to "sequence"
        Values can be: None (don't plot), "sequence" (color by nucleotide identity),
        "position" (position in sequence), "annotations" (sequence annotations),
        "profile" (per-nucleotide data from profile argument),
        "structure" (base-pairing status), a single matplotlib color for all positions,
        or an array of one color per position which matches the structure length.
    column : string, defaults to profile.metric
        column name of values from profile to use in regression
    region : list of 2 integers, defaults to [1, length of sequence]
        start and end nucleotide positions to include. 1-indexed, inclusive
    colorbars : bool, defaults to ``True``
        Whether to plot colorbars for scatter plot colors
    plot_kwargs : dict, defaults to {}
        Keyword-arguments passed to matplotlib.pyplot.subplots

    Returns
    -------
    rnavigate.plots.LinReg
        object containing matplotlib figure and axes with additional plotting and
        file saving methods