Alignment plots
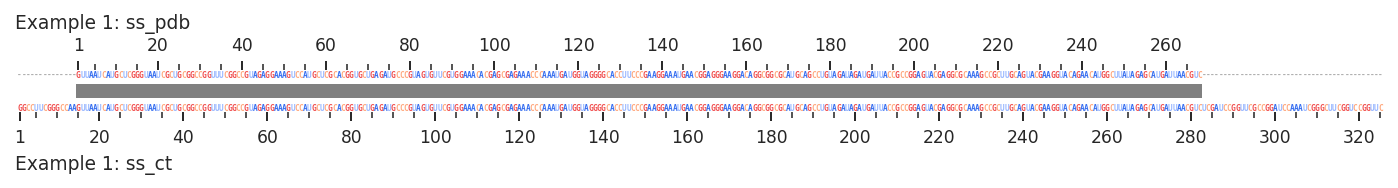
Alignment plots are a quick way to visualize how RNAvigate is positionally aligning two data sets. The two sequences will be displayed along the x-axis, with dashes inserted where there are insertions/deletions. A simplified visualization of the alignment appears between the sequences, with grey bars indicating the sequence agreement. The x-axes show the positional alignment used by RNAvigate to compare sequences.
[1]:
import rnavigate as rnav
from rnavigate.examples import rnasep_1, rmrp
These two structure models differ only in that one contains structure cassettes on the 5’ and 3’ ends.
This is what a good alignment looks like:
[2]:
plot = rnav.plot_alignment(
    data1=(rnasep_1, "ss_ct"),
    data2=(rnasep_1, "ss_pdb"),
)
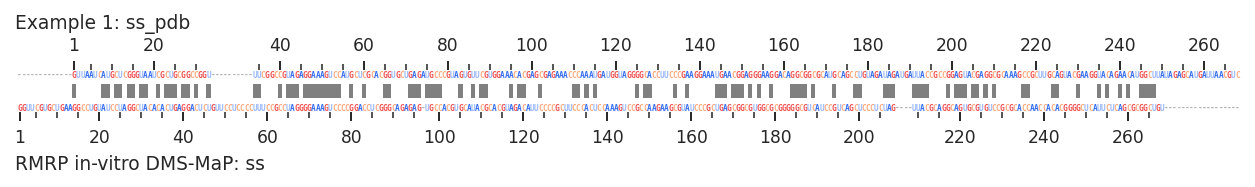
RNAse P and RNAse MRP have structural conservation, but their sequences diverge substantially.
Positions will be aligned even though there is very little sequence similarity
This is what a bad alignment looks like:
[3]:
plot = rnav.plot_alignment(
    data1=(rmrp, "ss"),
    data2=(rnasep_1, "ss_pdb"),
)
[4]:
help(rnav.plot_alignment)
Help on function plot_alignment in module rnavigate.plotting_functions:

plot_alignment(data1, data2, labels=None, plot_kwargs=None)
    Plots the sequence alignment used to compare two sequences

    Parameters
    ----------
    data1 : tuple (rnavigate Sample, data keyword string)
        a sample and data keyword to retrieve a sequence
    data2 : tuple (rnavigate Sample, data keyword string)
        another sample and data keyword to retrieve a second sequence
    labels : list of 2 strings, defaults to "sample.sample: data keyword" for each
        Labels used for each sample
    plot_kwargs : dict, defaults to {}
        passed to matplotlib.pyplot.subplots()

    Returns
    -------
    rnavigate.plots.Alignment
        the Alignment plot object