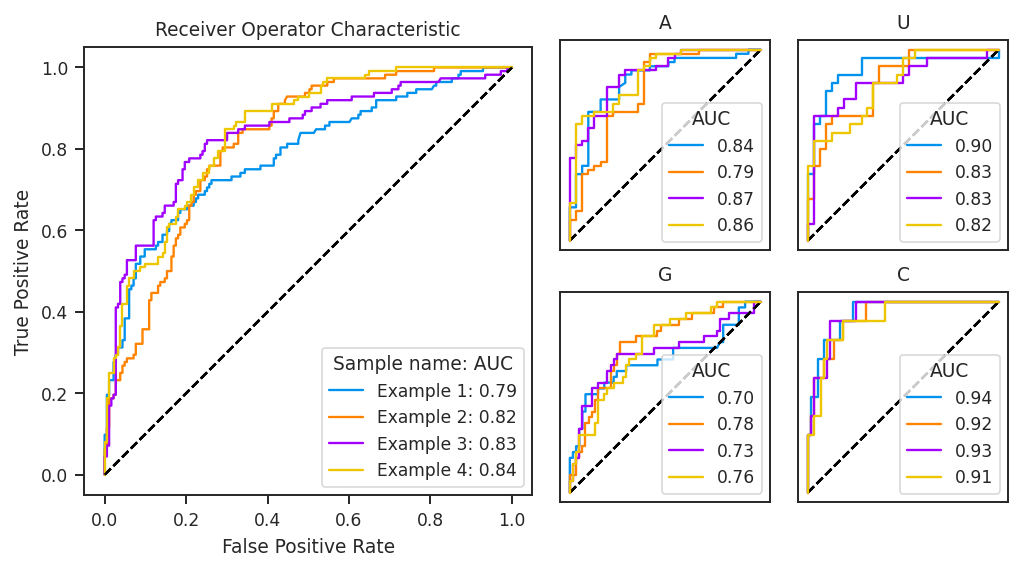
Receiver operator characteristic curves
Receiver operator characteristic (ROC) curves illustrate the ability of per-nucleotide data to predict base-paired vs. single stranded nucleotides. RNAvigate’s ROC plot draws the ROC curve for all values and for each nucleotide. RNAvigate calculates the area under the ROC curve (AUC) and displays it in the legend. Higher values, approaching 1, are better, while 0.5 is not better than random guessing.
In short, a threshold value splits the per-nucleotide data. The fraction of nucleotides above this threshold that are single-stranded is the True Positive Rate (TPR). The fraction of base-paired nucleotides that fall above the threshold is the False Positive Rate (FPR). The ROC curve connects the TPR and FPR of every possible threshold value. Perfect predictors, at some point, acheive a TPR of 1 and FPR of 0. The area under this curve would be 1.
[1]:
import rnavigate as rnav
from rnavigate.examples import rnasep_1, rnasep_2, rnasep_3, rnasep_4

plot = rnav.plot_roc(
    samples=[rnasep_1, rnasep_2, rnasep_3, rnasep_4],
    structure="ss_ct",
    profile="shapemap",
)
[2]:
help(rnav.plot_roc)
Help on function plot_roc in module rnavigate.plotting_functions:

plot_roc(samples, structure, profile, labels=None, nts='AUCG', plot_kwargs=None)
    Performs receiver operator characteristic analysis (ROC), calculates
    area under ROC curve (AUC), and generates ROC plots to assess how well
    per-nucleotide data predicts base-paired status. Does this for all
    positions as well as positions categorized by nucleotide
    5 plots: All, A, U, C, G

    Parameters
    ----------
    samples : list of rnavigate Samples
        samples used to retrieve data
    structure : data keyword string or data object
        secondary structure to use as classifier (paired or unpaired)
        profile data for each sample is first aligned to this structure
    profile : data keyword string or data object
        per-nucleotide data to perform ROC analysis
    labels : list of strings, defaults to sample.sample for each sample
        list containing Labels to be used in plot legends
    nts : string, defaults to "AUCG"
        which nucleotides to plot nucleotide-type ROC plots
    plot_kwargs : dict, defaults to {}
        Keyword-arguments passed to matplotlib.pyplot.subplots

    Returns
    -------
    rnavigate.plots.ROC
        object containing matplotlib figure and axes with additional plotting and
        file saving methods