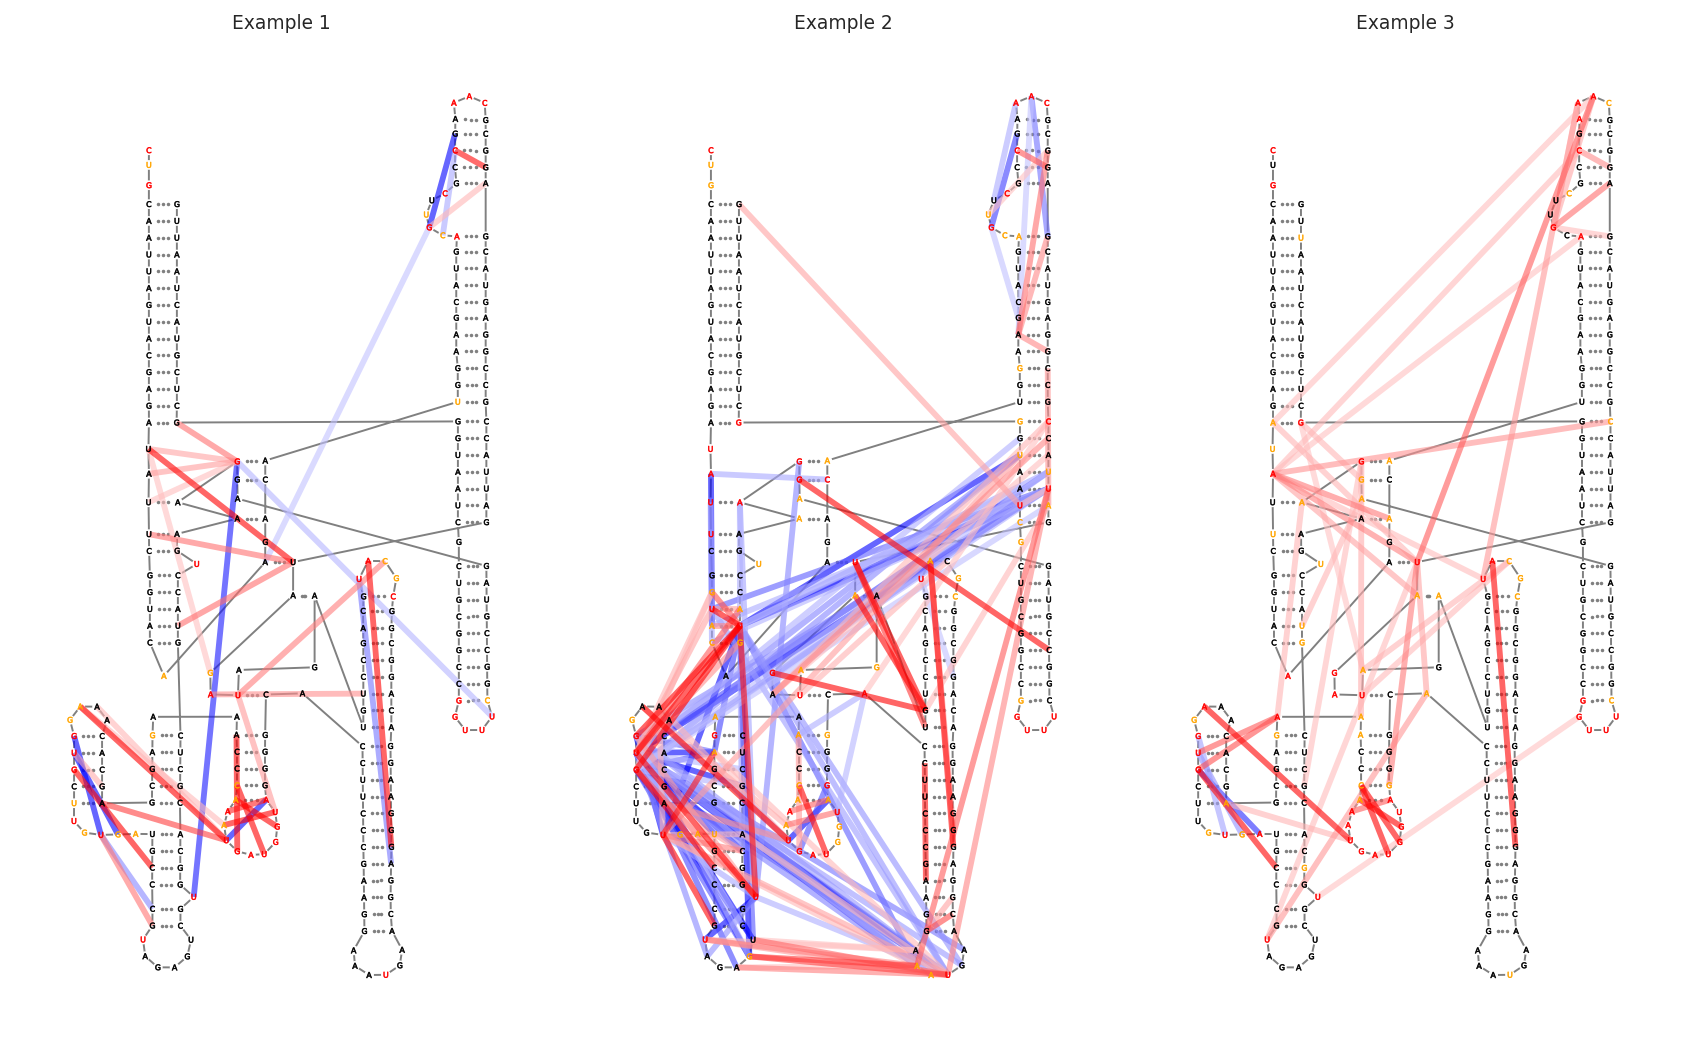
Secondary structure drawings
Secondary structure drawings are a standard and intuitive way to visualize secondary structures. It is also a useful way to visualize sequence annotations and per-nucleotide and inter-nucleotide data in the context of a secondary structure. RNAvigate will not make the layout for you, but it will accept file formats from StructureEditor, R2DT, VARNA, XRNA, and FORNA.
[1]:
import rnavigate as rnav
from rnavigate.examples import rnasep_1, rnasep_2, rnasep_3

plot = rnav.plot_ss(
    samples=[rnasep_1, rnasep_2, rnasep_3],
    structure="ss_pdb",
    profile="shapemap",
    interactions="ringmap",
    colors={"sequence": "profile"}
)
[2]:
help(rnav.plot_ss)
Help on function plot_ss in module rnavigate.plotting_functions:

plot_ss(samples, structure, profile=None, annotations=None, interactions=None, interactions2=None, labels=None, colors=None, nt_ticks=None, bp_style='dotted', colorbars=True, plot_kwargs=None)
    Generates a multipanel secondary structure drawing with optional
    coloring by per-nucleotide data and display of inter-nucleotide data and/or
    sequence annotations. Each plot may display a unique sample and/or
    inter-nucleotide data filtering scheme.

    Parameters
    ----------
    samples : list of rnavigate Samples
        samples used to retrieve data
    structure : data keyword string or data object
        secondary structure to plot as arcs
        All data are mapped to this sequence before plotting
    profile : data keyword string or data object, defaults to None
        Profile used for coloring if "profile" used in colors dictionary
    annotations : list of data keyword strings or data objects, defaults to []
        Annotations used to highlight regions or sites of interest
    interactions : one of the formats below, defaults to None
        format 1 (data or data keyword)
            Interactions to plot on secondary structure, no filtering
        format 2 (dictionary)
            e.g. {"interactions": format 1}
            additional filtering options can be added to the dictionary
        format 3 (list of format 2 dictionaries)
            This format allows multiple filtering schemes to be applied,
            each will be plotted on a seperate axis
    interactions2 : one of the formats below, defaults to None
        format 1 (data or data keyword)
            Interactions to plot on secondary structure, no filtering
        format 2 (dictionary)
            e.g. {"interactions": format 1}
            additional filtering options can be added to the dictionary
    labels : list of strings, defaults to sample.sample for each sample
        list containing Labels to be used in plot legends
        Defaults to sample.sample for each sample
    colors : dictionary, optional
        a dictionary of element: value pairs that determines how colors
        will be applied to each plot element and if that element is plotted
        only the elements you wish to change need to be included
        Keys can be "sequence" (letter labels), "nucleotides" (circles behind letters),
        "structure" (lines connecting nucleotides), and
        "basepairs" (lines connecting base-paired nucleotides).
        Values can be: None (don't plot), "sequence" (color by nucleotide identity),
        "position" (position in sequence), "annotations" (sequence annotations),
        "profile" (per-nucleotide data from profile argument),
        "structure" (base-pairing status), a single matplotlib color for all positions,
        or an array of one color per position which matches the structure length.
        "sequence" may also use "contrast" which automatically chooses white or black
        for each letter to contrast with that "nucleotide" color.
        Defaults to {"sequence": None, "nucleotides": "sequence", "structure": "grey",
        "basepairs": "grey"}
    nt_ticks : integer, defaults to None (no labels)
        gap between major tick marks
    bp_style : "dotted", "line", or "conventional", defaults to "dotted"
        "dotted" plots basepairs as a dotted line
        "line" plots basepairs as a solid line
        "conventional" plots basepairs using Leontis-Westhof conventions for canonical
        and wobble pairs ("G-A" plotted as solid dot)
    colorbars : bool, defaults to True
        Whether to plot color scales for all plot elements
    plot_kwargs : dict, defaults to {}
        Keyword-arguments passed to matplotlib.pyplot.subplots

    Returns
    -------
    rnavigate.plots.SS plot
        object containing matplotlib figure and axes with additional plotting and
        file saving methods