Circle plots
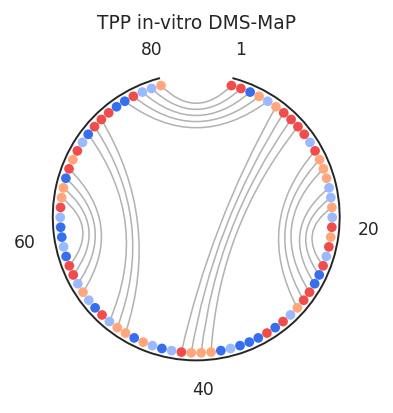
Circle plots arrange nucleotides 5’ to 3’ around a circle and are a useful visualization for multiple layers of RNA data, especially long RNAs with long primary distance interactions. Sequence annotations, per-nucleotide data, inter-nucleotide data, and secondary structures can be displayed.
[1]:
import rnavigate as rnav
from rnavigate.examples import tpp

plot = rnav.plot_circle(
    samples=[tpp],
    sequence="ss",
    structure="ss",
)
[2]:
help(rnav.plot_circle)
Help on function plot_circle in module rnavigate.plotting_functions:
plot_circle(samples, sequence, structure=None, structure2=None, interactions=None, interactions2=None, annotations=None, profile=None, colors=None, nt_ticks=(20, 5), gap=30, labels=None, colorbars=True, plot_kwargs=None)
Creates a figure containing a circle plot for each sample given.
Data that can be plotted on circle plots includes annotations (highlights
regions around the edge.Generates a multipanel secondary structure drawing
with optional coloring by per-nucleotide data and display of inter-
nucleotide data and/or sequence annotations. Each plot may display a unique
sample and/or inter-nucleotide data filtering scheme.
Parameters
----------
samples : list of rnavigate Samples
samples used to retrieve data
sequence : data or data keyword
All data are mapped to this sequence before plotting
structure : data keyword string or data object, defaults to None
Structure used to plot base-pairs on circle plot
structure2 : data keyword str, data obj or list of either, defaults to None
Structures to compare with Structure. Each base-pair is colored by
which structure contains it or how many structures contain it.
interactions : one of the formats below, defaults to None
format 1 (data or data keyword)
Interactions to plot on cirle plot, no filtering
format 2 (dictionary)
e.g. {"interactions": format 1}
additional filtering options can be added to the dictionary
format 3 (list of format 2 dictionaries)
This format allows multiple filtering schemes to be applied,
each will be plotted on a seperate axis
interactions2 : one of the formats below, defaults to None
format 1 (data or data keyword)
Interactions to plot on circle plot, no filtering
format 2 (dictionary)
e.g. {"interactions": format 1}
additional filtering options can be added to the dictionary
annotations : list of data keyword strings or data objects, defaults to []
Annotations used to highlight regions or sites of interest
profile : data keyword string or data object, defaults to None
Profile used for coloring if "profile" used in colors dictionary
labels : list of strings, defaults to sample.sample for each sample
list containing Labels to be used in plot legends
colors : dictionary, optional
a dictionary of element: value pairs that determines how colors
will be applied to each plot element and if that element is plotted
only the elements you wish to change need to be included
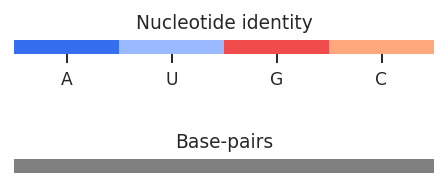
Keys can be "sequence" (letter labels), "nucleotides" (circles behind letters),
"structure" (lines connecting nucleotides), and
"basepairs" (lines connecting base-paired nucleotides).
Values can be: None (don't plot), "sequence" (color by nucleotide identity),
"position" (position in sequence), "annotations" (sequence annotations),
"profile" (per-nucleotide data from profile argument),
"structure" (base-pairing status), a single matplotlib color for all positions,
or an array of one color per position which matches the structure length.
"sequence" may also use "contrast" which automatically chooses white or black
for each letter to contrast with that "nucleotide" color.
Defaults to {"sequence": None, "nucleotides": "sequence", "structure": "grey"}
nt_ticks : tuple of two integers, defaults to (20, 5)
first integer is the gap between major tick marks
second integer is the gap between minor tick marks
gap : integer, defaults to 30
Width of gap between 5' and 3' end in degrees
colorbars : bool, defaults to True
Whether to plot color scales for all plot elements
plot_kwargs : dict, defaults to {}
Keyword-arguments passed to matplotlib.pyplot.subplots
Returns
-------
rnavigate.plots.Circle
object containing matplotlib figure and axes with additional plotting and
file saving methods